Available Slices

To edit the entire Slices screen, click on the Edit button on the upper right of the screen.



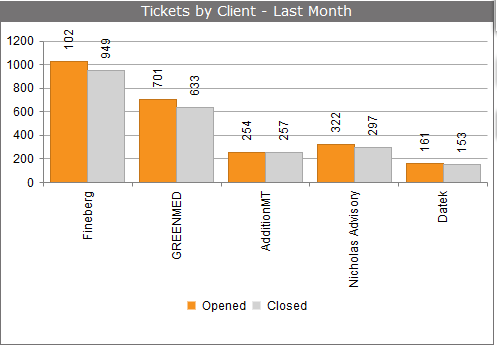
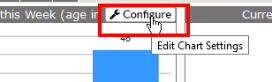
To edit a single Slice, click on the Configure button at the top of the chart.
 

The following charts are available for configuration. Click on the link to be taken to the options available within each Slice.

Tickets By CSAT Rating Top Users
Top Clients Average Response Time Totals
Rich Text Block Average Resolve Times Today's Risk/Late
Ticket Age Ticket Trend Ticket Closed Stats
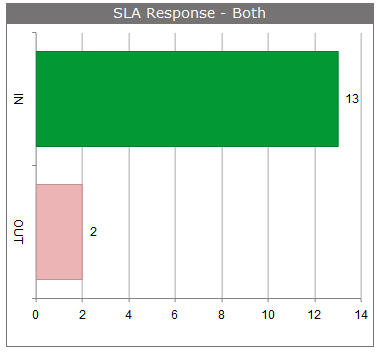
SLA Performance Opened vs. Closed  


General notes

  • Select the Chart type from the drop down at the top of the Chart Settings grid
  • Enter the Title for the chart
    • Click on the 'wand' next to the Title block to show any Phrased Fields available to include in the Slice title
  • Option notes:
    • Top X range is 1 to 50
    • The Last X days option maxes out at 30 days
    • The Last X months option maxes out at 12 months
    • Last X Calendar Months EXCLUDES the current month
    • When selecting a Custom date range, a dual calendar will appear to put in your start and end dates
    • If you select the Closed tickets or Both option, the date range is capped at one year from today's date
    • When selecting Rotate Labels, you can put in up to 360 degrees
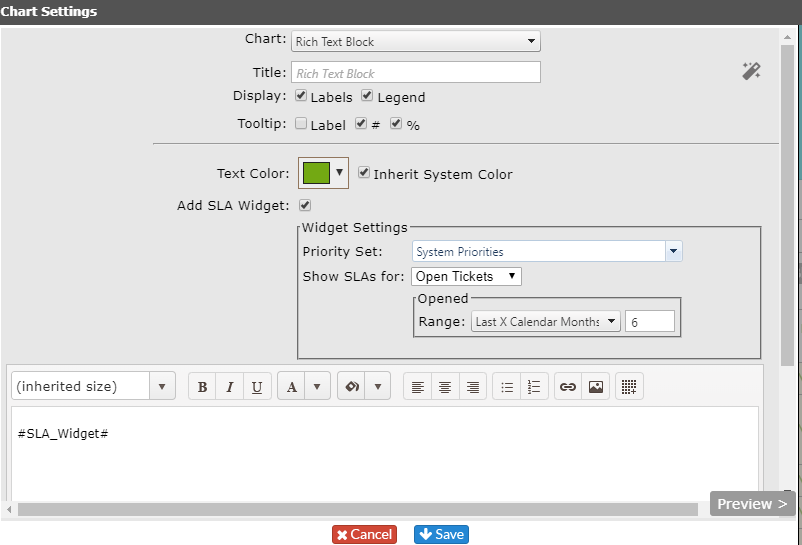
    • In the Rich Text Block option, click on Design to have the text editor to select type face, size, etc.
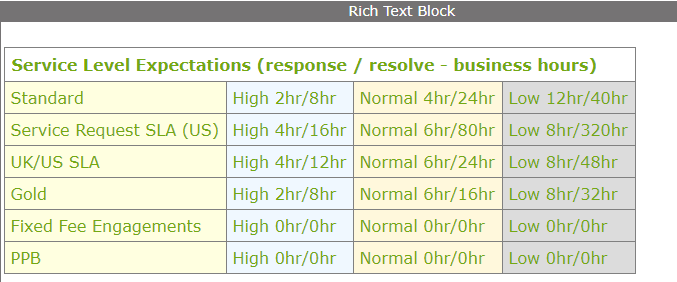
    • In the Rich Text Block option, the Service Level Widget will show a list of SLA's which appear in tickets Opened or Closed in the configured date range.


Mouse over the image to see a larger example.

Slice Options Available

Chart

Example

Edit screen
None No Slice will be visible    
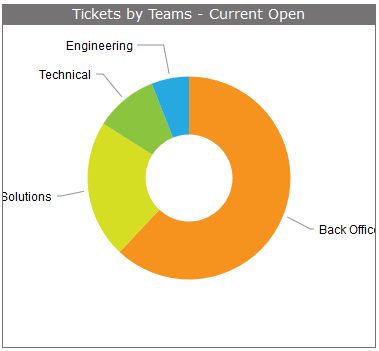
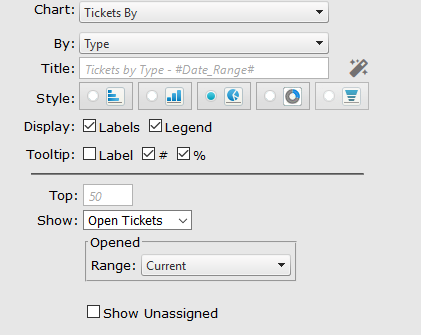
Tickets By

Type:

  • Type
  • Team
  • Status
  • Project Type
  • State
  • Queue
  • Client
  • Priority
  • Office
  • Source
  • End User
  • Client Type
  • Region
  • SLA
  • Project


Style:

  • Bar Graph
  • Column Graph
  • Pie Graph
  • Donut Graph
  • Funnel Graph

Display:

  • Labels
  • Legend

Tooltip:

  • Label
  • #
  • %

Top:

  • Numerical value

Show:

  • Open Tickets
  • Closed Tickets
  • Both

Range:

  • Current
  • Today
  • Yesterday
  • This Week
  • Last Week
  • This Month
  • Last Month
  • This Quarter
  • Year to Date
  • Custom
  • Last X Days
  • Last X Months
  • Last X Calendar Months


Show By State/Show Unassigned

  • Check to show
  • Uncheck to hide


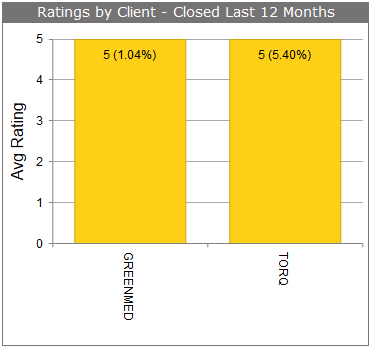
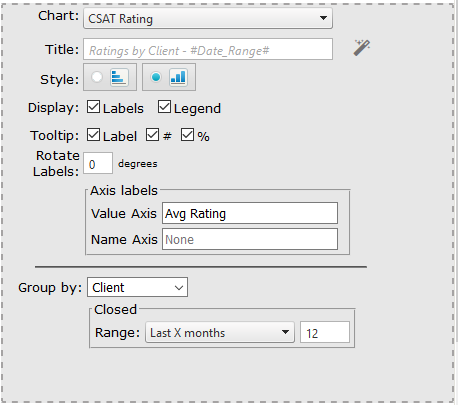
CSAT Rating

Style:

  • Bar Graph
  • Column Graph

Display:

  • Labels
  • Legend

Tooltip:

  • Label
  • #
  • %

Rotate Labels:

  • # degrees
  • Axis Labels
    • Value Axis (Text)
    • Name Axis (Text)

Group by:

  • Client
  • Ticket Closer
  • Project
  • Office
  • End User

Closed Range:

Range:

  • Current
  • Today
  • Yesterday
  • This Week
  • Last Week
  • This Month
  • Last Month
  • This Quarter
  • Year to Date
  • Custom
  • Last X Days
  • Last X Months
  • Last X Calendar Months
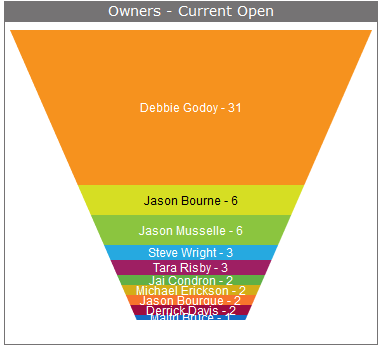
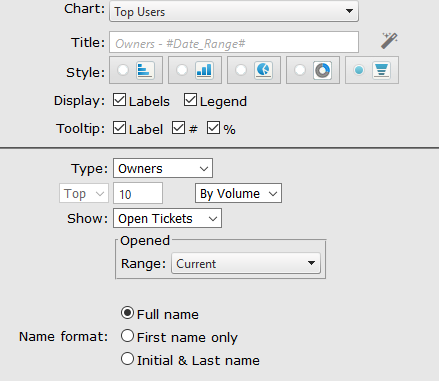
Top Users

Style:

  • Bar Graph
  • Column Graph
  • Pie Graph
  • Donut Graph
  • Funnel Graph

Display:

  • Labels
  • Legend

Tooltip:

  • Label
  • #
  • %

Rotate Labels:

  • # degrees
  • Axis Labels
    • Value Axis (Text)
    • Name Axis (Text)

Type:

  • Owners
  • End Users
  • Closers

Top/Bottom

  • Insert appropriate number
  • Select one of the following:
    • By Volume
    • By Time
  • Show non-billable time

Show:

  • Open Tickets
  • Closed Tickets
  • Both

Range:

  • Current
  • Today
  • Yesterday
  • This Week
  • Last Week
  • This Month
  • Last Month
  • This Quarter
  • Year to Date
  • Custom
  • Last X Days
  • Last X Months
  • Last X Calendar Months

Name format:

  • Full name
  • First name only
  • Initial & Last name
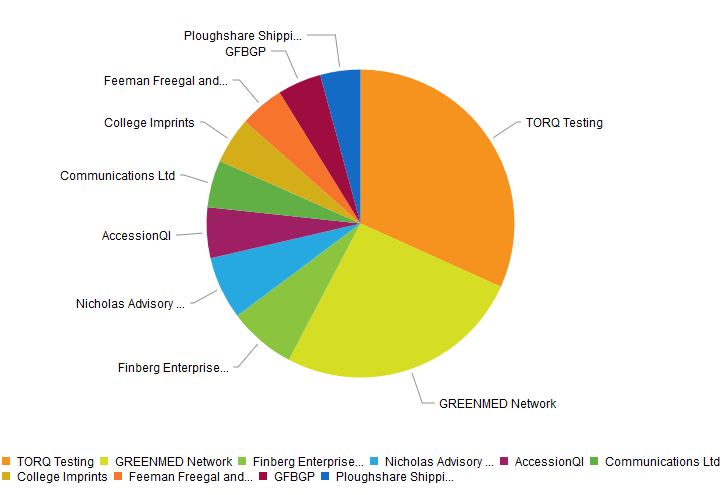
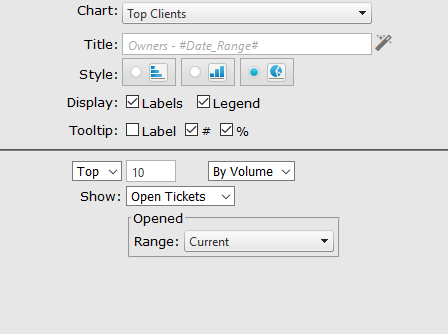
Top Clients

Style:

  • Bar Graph
  • Column Graph
  • Pie Graph

Display:

  • Labels
  • Legend

Tooltip:

  • Label
  • #
  • %

Rotate Labels:

  • # degrees
  • Axis Labels
    • Value Axis (Text)
    • Name Axis (Text)

Top/Bottom

  • Insert appropriate number
  • Select one of the following:
    • By Volume
    • By Time
  • Show non-billable time

Show:

  • Open Tickets
  • Closed Tickets
  • Both

Range:

  • Current
  • Today
  • Yesterday
  • This Week
  • Last Week
  • This Month
  • Last Month
  • This Quarter
  • Year to Date
  • Custom
  • Last X Days
  • Last X Months
  • Last X Calendar Months
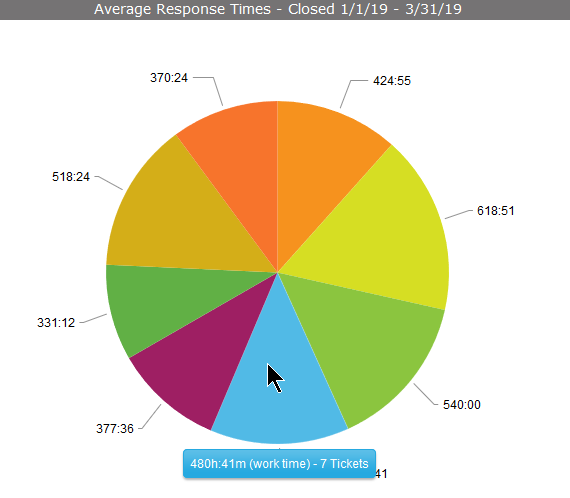
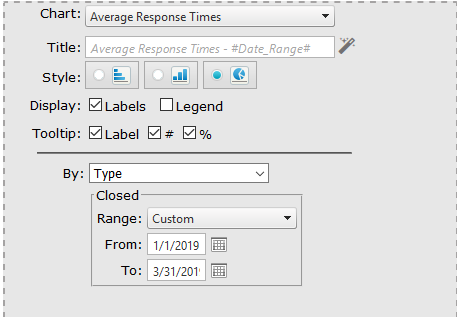
Average Response Time

Style:

  • Bar Graph
  • Column Graph
  • Pie Graph

Display:

  • Labels
  • Legend

Tooltip:

  • Label
  • #
  • %

Rotate Labels:

  • # degrees
  • Axis Labels
    • Value Axis (Text)
    • Name Axis (Text)

Top:

  • Enter number

By:

  • Priority
  • Client
  • Project
  • Office
  • Type
  • SLA
  • Team
  • Support Staff
  • (None)

Closed Range:

Range:

  • Today
  • Yesterday
  • This Week
  • Last Week
  • This Month
  • Last Month
  • This Quarter
  • Year to Date
  • Custom
  • Last X Days
  • Last X Months
  • Last X Calendar Months
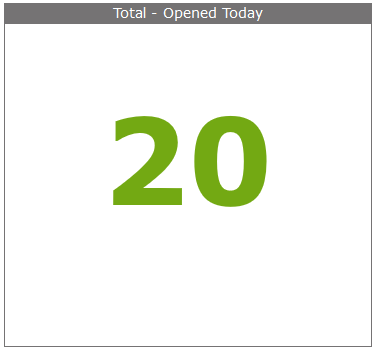
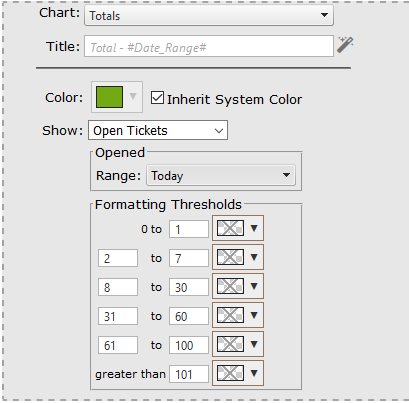
Totals

Color:

  • Select color from drop down or use check box to inherit your system color

Show:

  • Open Tickets
  • Closed Tickets
  • Avg Response Time
  • In SLA Response %
  • In SLA Resolve %
  • Active Offices

Opened Range:

  • Current
  • Today
  • Yesterday
  • This Week
  • Last Week
  • This Month
  • Last Month
  • This Quarter
  • Year to Date
  • Custom
  • Last X Days
  • Last X Months
  • Last X Calendar Months

Formatting Thresholds:

  • Set the levels (as many as needed)
  • From drop down next to level, select the color you want it to show on the chart
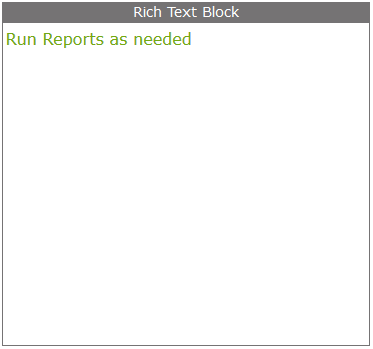
Rich Text Block

Display:

  • Labels
  • Legend

Tooltip:

  • Label
  • #
  • %

Text Color:

  • Select color from drop down or use check box to inherit your system color

Type in the text you want in the box below Text Color.

  • Click on Design to get the editor to select type face, size, etc.
  • Click on Preview to see what it looks like before saving.

Add SLA Widget

  • Check box to add the SLA Widget

Widget Settings

  • Priority Set - select the appropriate Priority Set
  • Show SLAs for:
    • Open Tickets
    • Closed Tickets
    • Both
  • Range
    • Current
    • Today
    • Yesterday
    • This Week
    • Last Week
    • This Month
    • Last Month
    • This Quarter
    • Year to Date
    • Custom
    • Last X Days
    • Last X Months
    • Last X Calendar Months


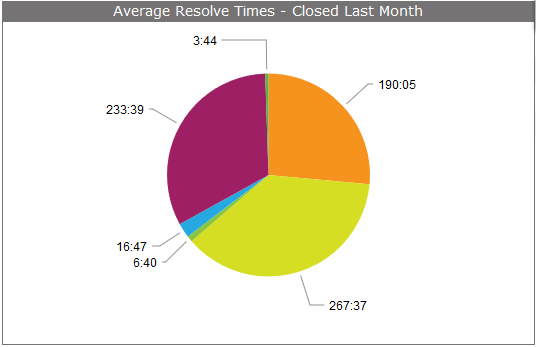
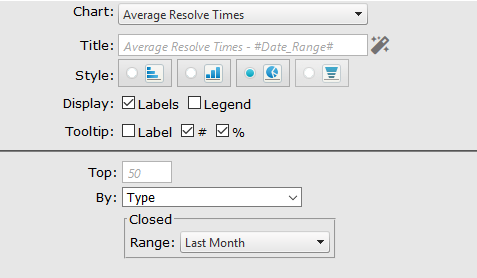
Average Resolve Times

Style:

  • Bar Graph
  • Column Graph
  • Pie Graph
  • Funnel Graph

Display:

  • Labels
  • Legend

Tooltip:

  • Label
  • #
  • %

Rotate Labels:

  • # degrees
  • Axis Labels
    • Value Axis (Text)
    • Name Axis (Text)

Top:

  • Enter number

By:

  • Priority
  • Client
  • Project
  • Office
  • Type
  • SLA
  • Team
  • Support Staff
  • (None)

Closed Range:

Range:

  • Today
  • Yesterday
  • This Week
  • Last Week
  • This Month
  • Last Month
  • This Quarter
  • Year to Date
  • Custom
  • Last X Days
  • Last X Months
  • Last X Calendar Months
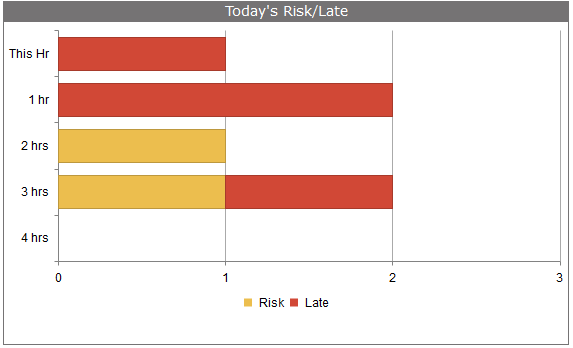
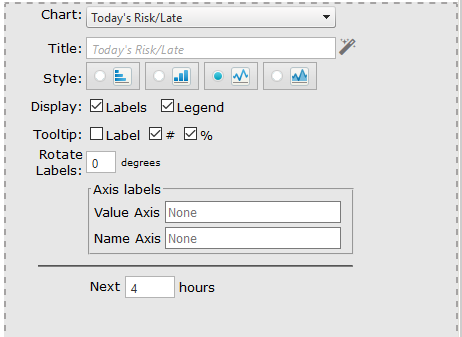
Today's Risk/Late

Style:

  • Bar Graph
  • Column Graph
  • Line Graph
  • Area Graph

Display:

  • Labels
  • Legend

Tooltip:

  • Label
  • #
  • %

Rotate Labels:

  • # degrees
  • Axis Labels
    • Value Axis (Text)
    • Name Axis (Text)

Next ___ hours

  • Select number of hours
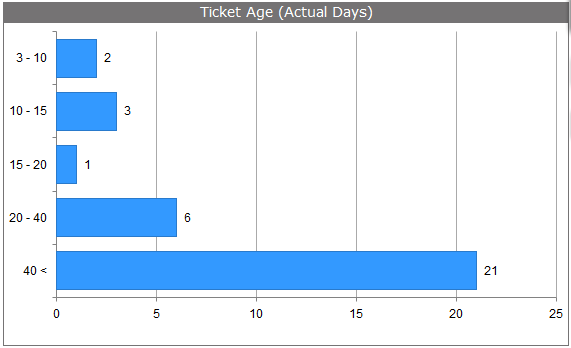
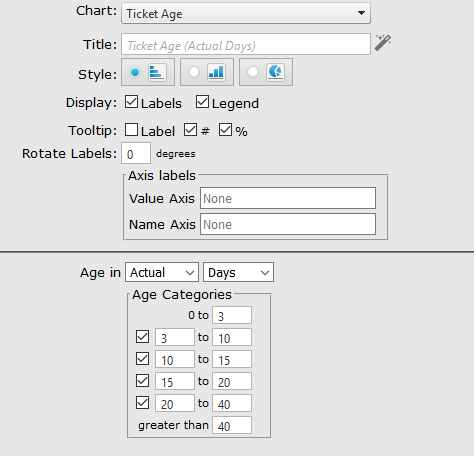
Ticket Age

Style:

  • Bar Graph
  • Column Graph
  • Pie Graph

Display:

  • Labels
  • Legend

Tooltip:

  • Label
  • #
  • %

Rotate Labels:

  • # degrees
  • Axis Labels
    • Value Axis (Text)
    • Name Axis (Text)

Age In:

  • Select from each drop down on this line:
    • Actual
    • Working
    • Minutes
    • Hours
    • Days
    • Months

Age Categories:

  • Select ranges
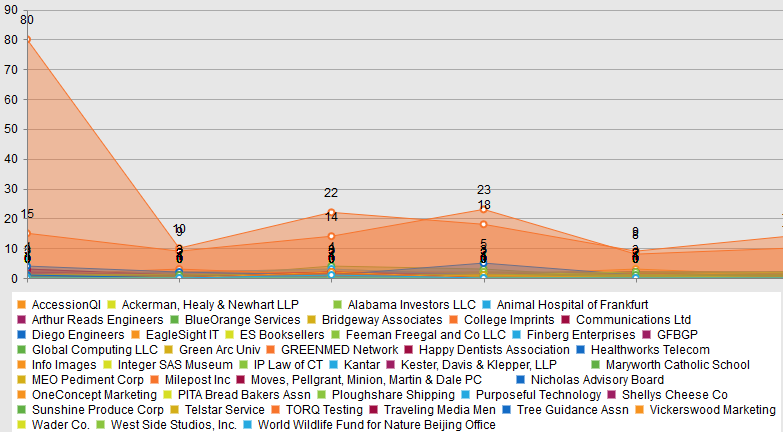
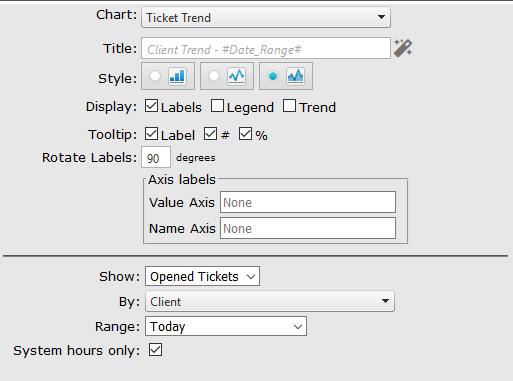
Ticket Trend

Style:

  • Bar Chart
  • Line Graph
  • Area Graph

Display:

  • Labels
  • Legend
  • Trend

Tooltip:

  • Label
  • #
  • %

Rotate Labels:

  • # degrees
  • Axis Labels
    • Value Axis (Text)
    • Name Axis (Text)

Show:

  • Opened Tickets
  • Closed Tickets

By:

  • Client
  • Type
  • Team
  • Project Type
  • Client
  • Priority
  • Office
  • Source
  • End User
  • Client Type
  • Region

Range:

  • Today
  • Yesterday
  • This Week
  • Last Week
  • This Month
  • Last Month
  • Last X Days
  • Last X Months
  • Last X Calendar Months
  • Year to Date
  • Last Year

System hours only:

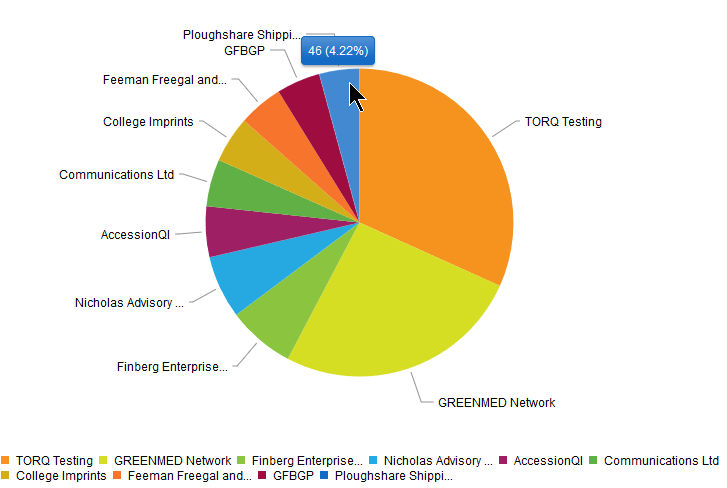
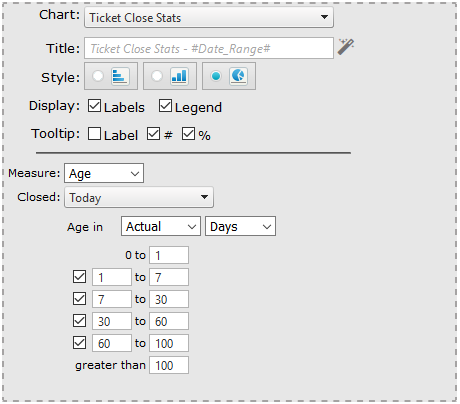
Ticket Closed Stats

Style:

  • Bar Graph
  • Column Graph
  • Pie Graph

Display:

  • Labels
  • Legend

Tooltip:

  • Label
  • #
  • %

Rotate Labels:

  • # degrees
  • Axis Labels
    • Value Axis (Text)
    • Name Axis (Text)

Measure:

  • Age
  • Volume
  • Time

Closed:

  • Today
  • Yesterday
  • This Week
  • Last Week
  • This Month
  • Last Month
  • This Quarter
  • Year to Date
  • Custom
  • Last X Days
  • Last X Months
  • Last X Calendar Months

Age in

    • Select from each drop down on this line:
      • Actual
      • Working
      • Minutes
      • Hours
      • Days
      • Months

Age Categories:

  • Select ranges
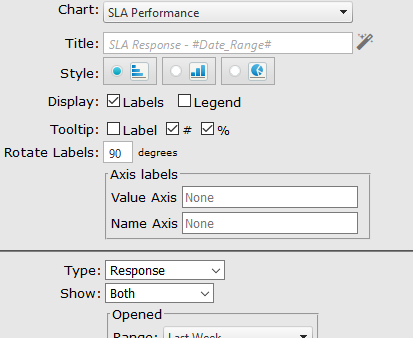
SLA Performance

Style:

  • Bar Graph
  • Column Graph
  • Pie Graph

Display:

  • Labels
  • Legend

Tooltip:

  • Label
  • #
  • %

Type:

  • Response
  • Resolve

Show:

  • Open Tickets
  • Closed Tickets
  • Both

Range:

  • Current
  • Today
  • Yesterday
  • This Week
  • Last Week
  • This Month
  • Last Month
  • This Quarter
  • Year to Date
  • Custom
  • Last X Days
  • Last X Months
  • Last X Calendar Months
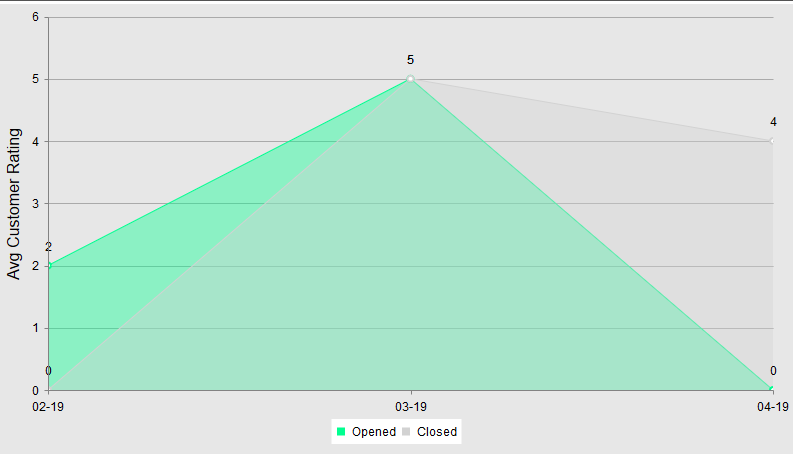
Opened vs. Closed

Style:

  • Bar Graph
  • Column Graph
  • Pie Graph

Display:

  • Labels
  • Legend
  • Trend

Tooltip:

  • Label
  • #
  • %

Rotate Labels:

  • # degrees
  • Axis Labels
    • Value Axis (Text)
    • Name Axis (Text)

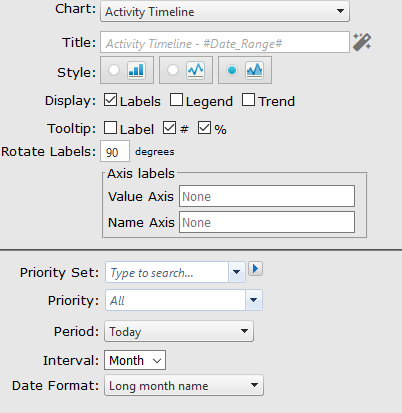
Priority Set:

  • Select one or more of the Priority Sets you have in your system

Priority:

  • Select the specific Priority to view

Period:

  • Today
  • Yesterday
  • This Week
  • Last Week
  • This Month
  • Last Month
  • This Quarter
  • Year To Date
  • Custom
  • Last X Days
  • Last X Months
  • Last X Calendar Months

Interval:

  • Hour
  • Day
  • Month

Date Format

  • Short date
  • Day & Month
  • Week day name