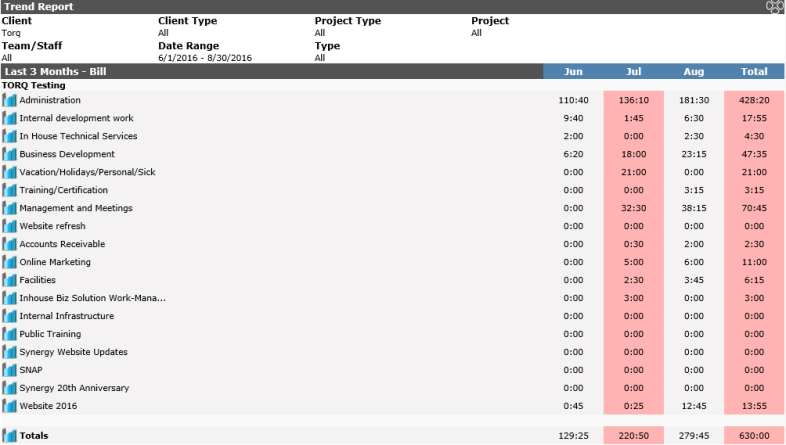
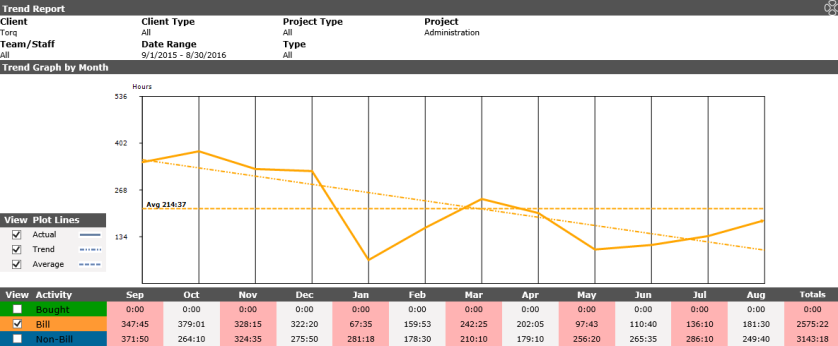
This report displays time used and is broken down into billable, non-billable and purchased time for a specific client/project. A graph visually displays the monthly time for these clients/projects, and shows an average line for the period. If volume is selected, the data shown will be for the number of tickets.
To run a full report, as with most of the report sections, the pull downs are left at the default (Select One) and the default time period of Last 3 Months.
The options for this report are as follows:
Report Type: Time or Volume default is set in Report Views, but either can be selected
Client Type: Select from drop down or leave at default.
Client: Multiple clients can be selected by clicking on the arrow. Click on each client you want to see while holding the Ctrl key. To see all the clients, simply leave the pull down box blank. However, if selecting multiple clients the project pull down will not be an option.
User: Allows you to select a user for the client. If no clients are selected, or if multiple clients are selected, this option is not available.
Project: Only available if a single client is selected.
Team: Select from drop down or leave at default for all.
Staff: Allows you to select a staff member. Leave at default position for all.
Location: The location for the client. If there are multiple locations, leaving at the default will show all locations.
Cost Center: Select single from drop down, select the arrow and use the Ctrl key for multiple cost centers, or leave at default for all.
Ticket Type: Select from the drop down or leave at default
Sub Type:Select from the drop down or leave at default
Show Time: While all time is shown, this option will select what is charted below the display. Default is Time Logged, Bought can be selected from the drop down.
Predefined Dates: The options are Last 3 Months (default), Last 6 Months, Last 12 Months and YTD (Year to Date).
Start Date/End Date: As with the other reports, you can specify a date range outside the predefined dates or select the specific date range with the calendar pull downs.
Interval:Choose from Month (default), Week or Day
The report displays based on the criteria specified. If no project is specified, all projects will show in a summary page. Select one to produce the graphic version. If you selected Time Logged as the time option, but now want to see Bought as well, check the box next to Bought in the summary below the grid. The report will redisplay with the additional information.
A line chart displays below the grid, showing the time options selected in their respective colors, along with an average of the time for that option over the period.