
The Slices home page allows you to see various charts and graphs, giving you a view to the information within Revelation helpdesk. By choosing various options on the left side of the screen, you can view information based on your Ticket Monitor, a custom filter or all tickets in your system.
View by Ticket Monitor
Selecting the Ticket Monitor option brings up the Ticket Monitor you view on your home page. Select the Support Staff, Team, Queue, Client, saved Searches, etc. from your monitor to view the Slices which pertain to those options.
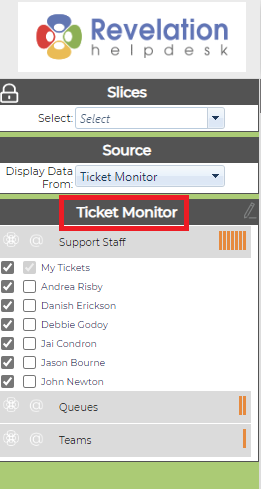
Note: You will be able to change the options on your Ticket Monitor from here. However, it will also change the Ticket Monitor on your home page.
View by Custom Filter
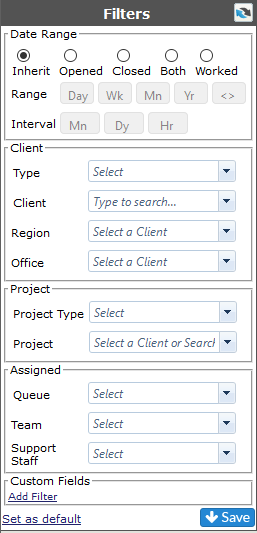
Select from a range of filters for your Slices. If you have saved Filters, they will appear in a drop down. Or, you can select from the various filters available to create a new Slice view. Click on Save if you want to retain this as a Saved Filter or click on Set as default if you want to keep this as the default view with Filters.
NOTE: If you are sharing or email a slice, the saved Filter view shared will be maintained.
| Date Range |
Inherit Opened Closed Both (Opened and Closed) Worked (Any ticket worked in the time frame) |
|
| Range |
Day
Week
Month
Year
< > (Click to set Custom Range) |
|
| Interval |
Month Day Hour |
|
| Client |
Type Client Region Office |
|
| Project |
Project Type Project |
|
| Assigned |
Queue Team Support Staff |
|
| Custom Fields | From drop down, select your Custom Form, and Field from the drop down |
All tickets
This option applies all tickets to the Slices on your page.
NOTE: You will get a warning message if you select this option as showing all tickets can have a negative impact on performance and can cause the system to load slowly. It may even time out. Be careful using this option.