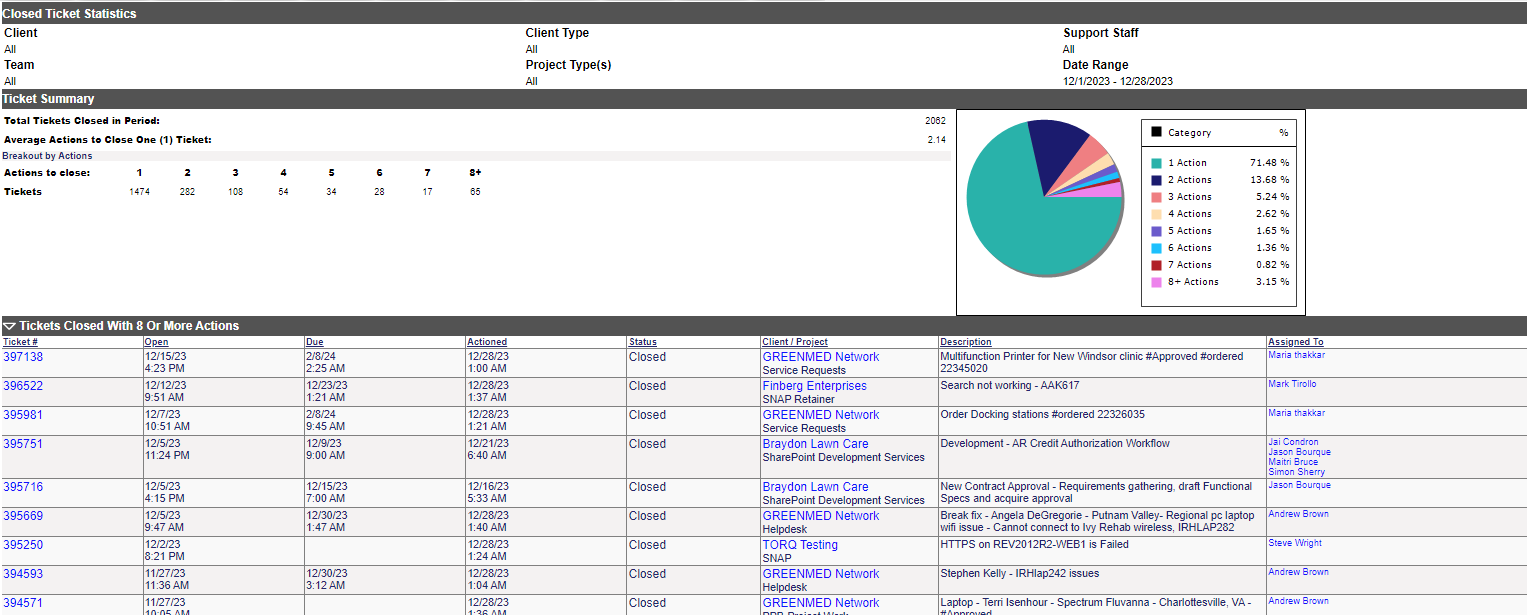
This report allows Administrators and Managers to see the average number of ticket actions on closed tickets for staff per client and/or cost center.
The options for this report are as follows:
Report Type: Time or Volume
Time Measured: Reported (Default), Actual, Working
Column Interval:Select between 1 and 9
Client Type: Select type
Client: Select the appropriate client
Office: The location for the client. If there are multiple locations, leaving at the default will show all locations.
Cost Center: Multiple cost centers can be selected by clicking on the arrow. Click on each cost center while holding the Ctrl key. If you want to see all the cost centers, simply leave the pull down box at the default.
Team: Select from drop down or leave at default for all.
Staff: Select the appropriate internal staff
Predefined Dates: The options are Today, This Week, Last Week, This Month (default) and Last Month.
Start Date/End Date: As with the other reports, you can specify a date range outside the predefined dates or select the specific date range with the calendar pull downs.
A pie chart displays indicating the average percent of closed tickets per the number of actions indicated in these closed tickets. Also displayed is staff selected, cost center, date range specified and total tickets closed in period.
A closed action summary displays the closed tickets indicating the number of actions 3 actions or less, 4-6 actions, 7-9 actions and 10 actions or more. Ticket numbers for those closed in 10 actions or more are provided with the ability to directly access the ticket details by clicking on the ticket number.